


 128 / 316

AfrAsia Bank Limited and its Group Entities
Annual Report 2015
page 126
1970
75
80
85
90
95
05
10
15
2000
-2
0
2
4
6
8
10
12
14
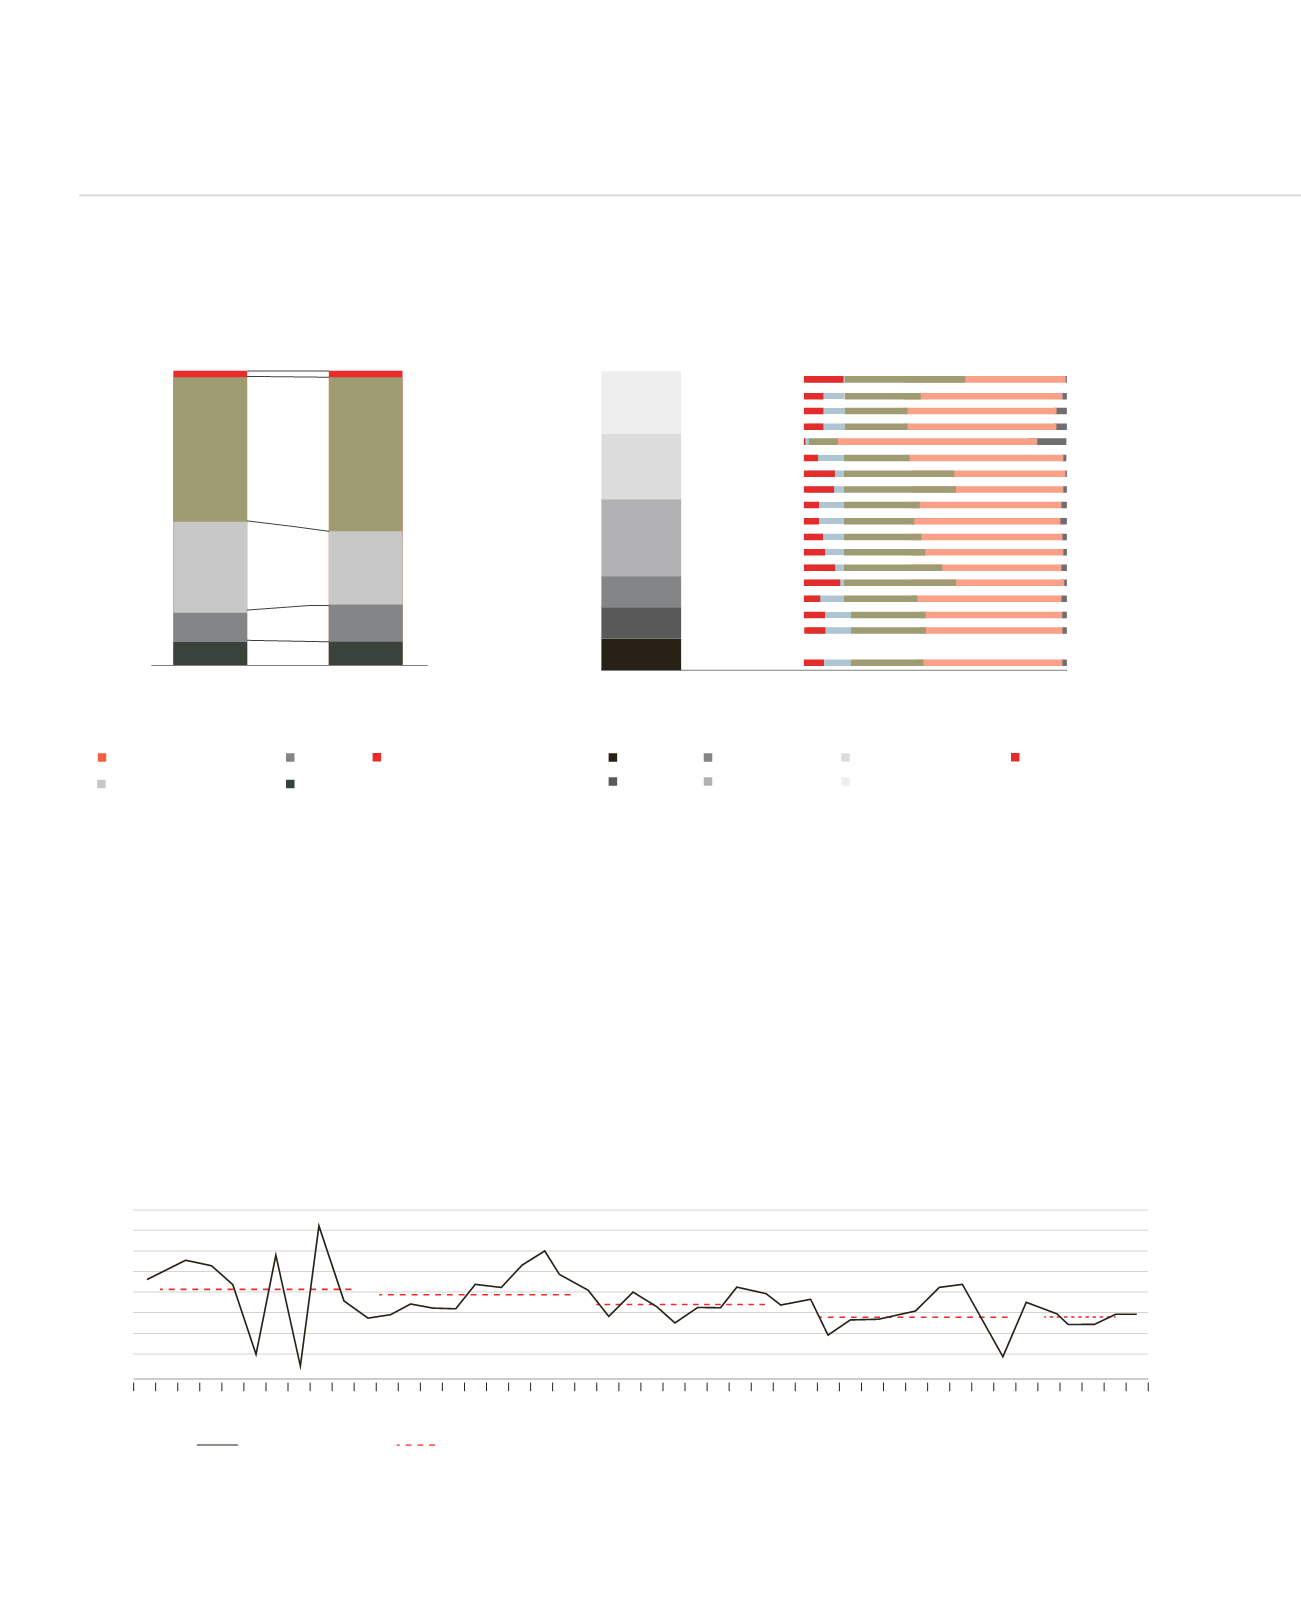
Average growth
Average decade growth
(GDP growth, percent)
MANAGEMENT DISCUSSION AND ANALYSIS (CONTINUED)
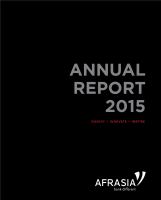
DISTRIBUTION OF POPULATION BY
INCOME CLASSES (2007 VS. 2012)
THE MIDDLE CLASS :
DEMOGRAPHIC CHARACTERISTICS, 2012
0%
10%
20%
30%
40%
50%
60%
70%
80%
90%
100%
2007
2012
Poor
Poor
Lower middle class
High middle class
Rich
Mauritius Population
Poor
All
Gender
Female head
Age group
Education
Household size
Total
Male
Female
Male head
Female head
0-15
15-24
24-35
35-64
64+
Without
Primary
Secondary
Tertiary
1 person
2-3 persons
4-5 persons
6+
0 20 40 60 80 100
Source: HBS 2007,2012
Source: HBS 2012
Mauritius is not alone in this situation. There are six other small middle-income countries facing this trap in sub-Saharan Africa namely
Botswana, Cabo Verde, Lesotho, Namibia, Seychelles and Swaziland.
The concept of a middle-income trap grew from the observation that middle-income countries graduated to high-income status far less
often than low-income countries became middle-income countries. From 1960 to 2012, fewer than 20% of middle-income countries and
none from sub-Saharan Africa became high-income states, compared with more than half of low-income countries graduating to middle-
income status.
Source: Mauritius Systematic Country Diagnostic, World Bank, 25 June 2015
While still positive, small middle-income countries’ growth has slowed, as previous growth drivers weaken and the rise in per capita income wanes.
DOWNWARD DECADES