


 133 / 316

AfrAsia Bank Limited and its Group Entities
Annual Report 2015
page 131
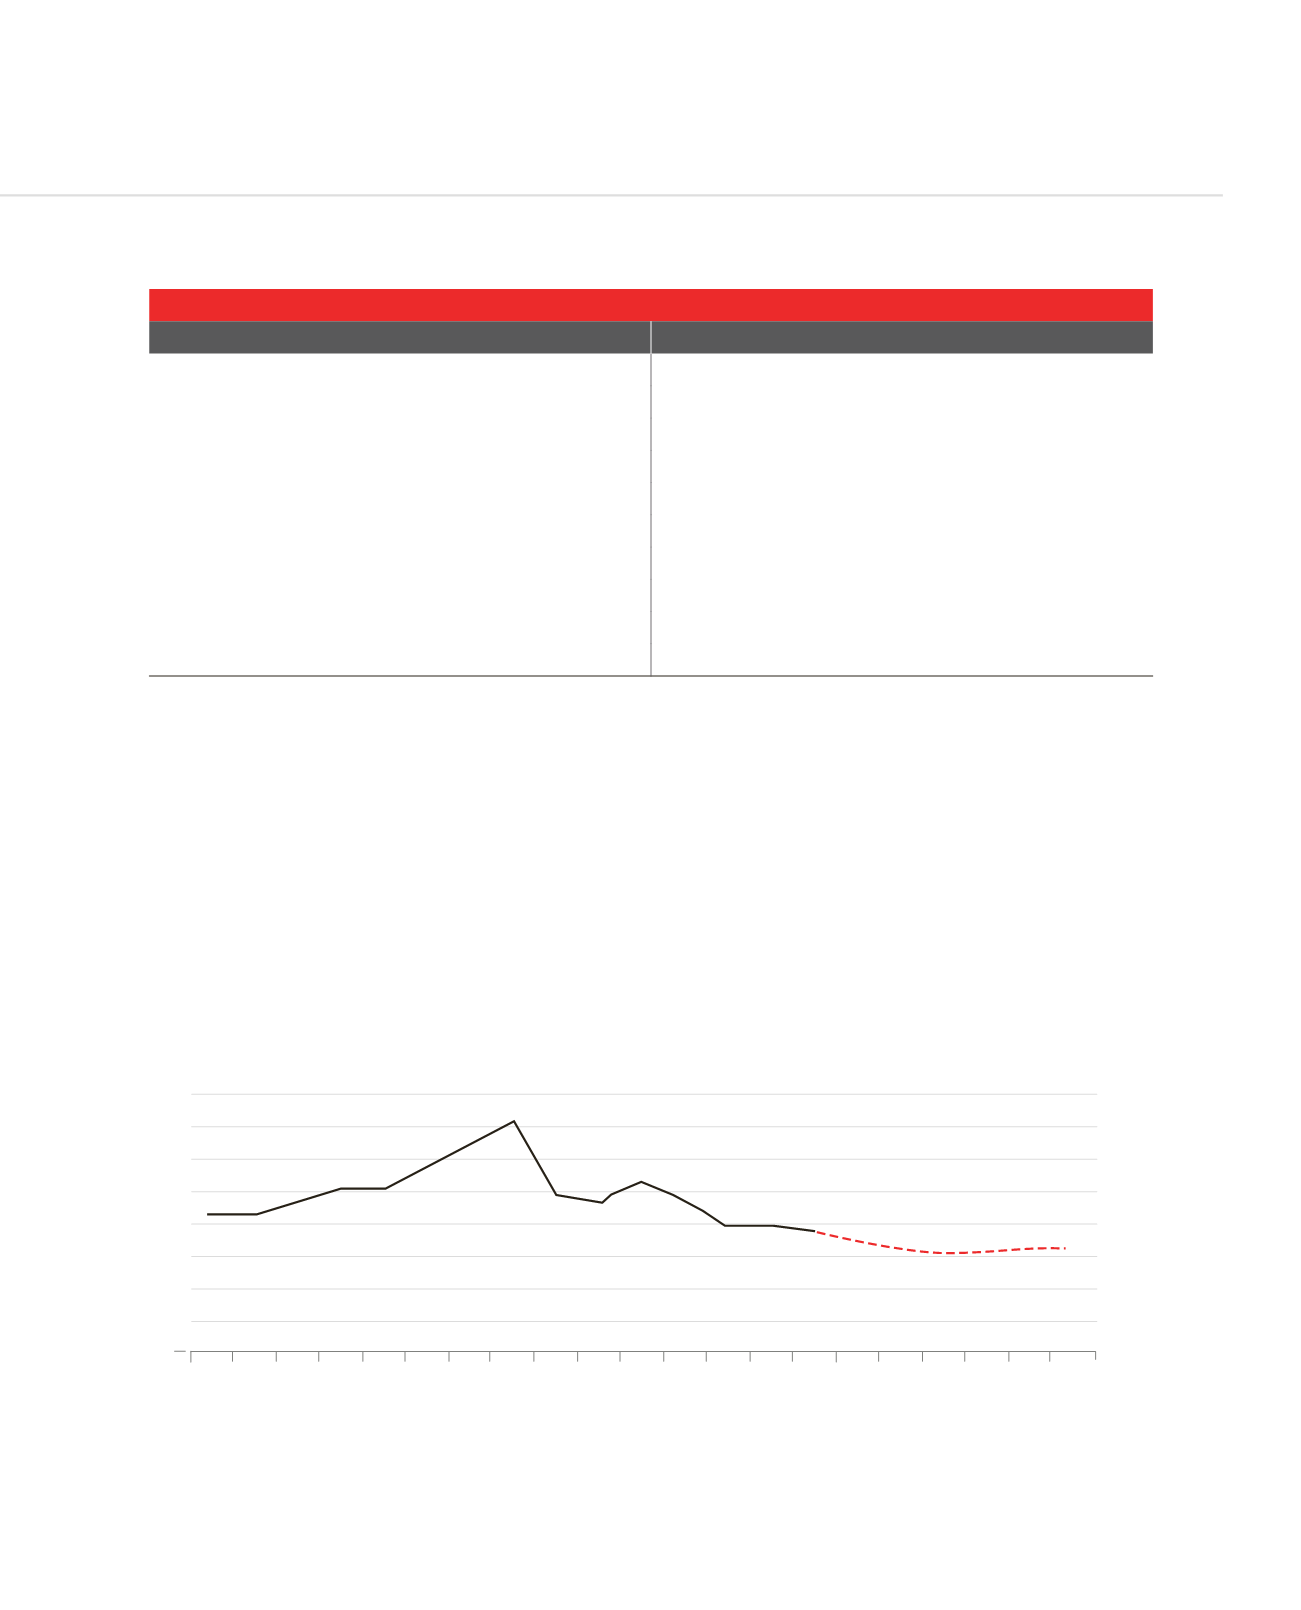
Top 10 destinations - H1 2015
Country
Capex ($bn)*
India
31
China
28
US
27
UK
16
Mexico
14
Indonesia
14
Vietnam
8
Spain
7
Malaysia
7
Australia
7
Prospects for India’s economy remain healthy though. FDI in the first half of 2015 amounted to some USD 31bn, putting the country
in the pole position in terms of foreign capital inflows, surpassing China (USD 28bn) and the US (USD 27bn), according to a report
in the Financial Times in September 2015. Since China’s stockmarket rout in August 2015, investment flows have increased further.
Several indicators also reveal that India’s economy is in better shape than China’s, including pace of growth, room for additional
stimulus, labour force participation rate, domestic consumption, levels of public debt, excess capacity, property prices and deflation
among others.
Most analysts forecast China’s growth engine would fail to generate the performance attained in the mid to late 2000’s in the
aftermath of the global financial crisis. The country is standing at the crossroads and calling for a rebalancing of the economy as
most of the key factors which led to two decades of double-digit growth begin to reach their potential.
Top 10 FDI destinations (first half of 2015)
Source: Financial Times, 29 September 2015
China’s growth rates – Past vs. future
6.3
6.0
6.8 6.3
7.4
7.8
14.2
2000
2001
2002
2003
2004
2005
2006
2007
2008
2009
2010
2011
2012
2013
2014
2015
2016
2017
2018
2019
2020
0
2
4
6
8
10
12
14
16
8.4
10.4
9.2