


 127 / 316

AfrAsia Bank Limited and its Group Entities
Annual Report 2015
page 125
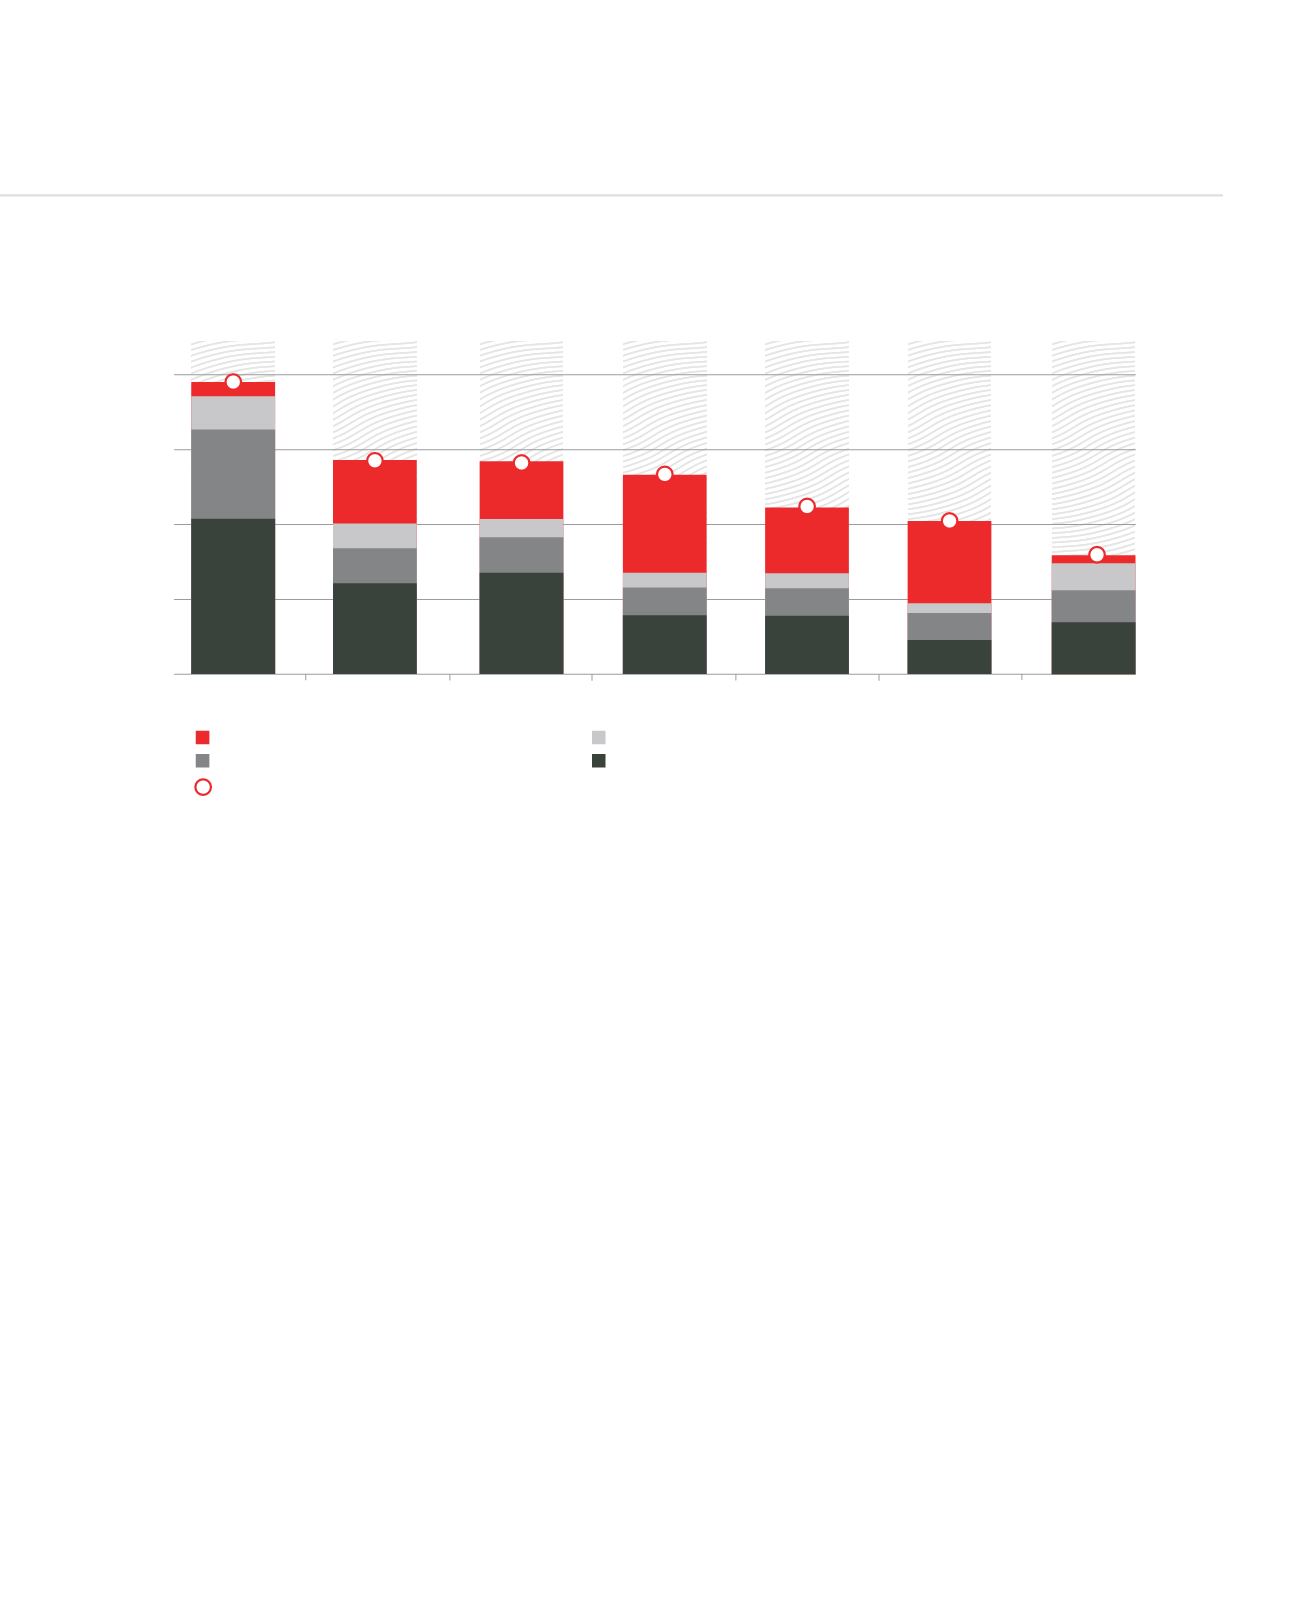
Mauritius - International Comparison of Total Factor Productivity (TFP) as the Driver of Growth
Source: Katsiaryna Svirydzenka and Martin Petri, “Mauritius – The driver of growth: Can the past be extended?”, IMF
0
2
4
6
8
China
Taiwan
Korea
Singapore
Hong Kong
India
Mauritius
Contribution from Human Capital
Contribution from TFP
Contribution from Labour
Contribution from Physical Capital
GDP/Capital Growth (in percent)
New realities facing the Mauritian economy: Emergence of a “middle-income trap” and threats to the middle-income class?
The spectre of a middle-income trap has been retaining the attention of policy-makers since 2014 and this has been fully documented
in the World Bank’s Systematic Country Diagnostic in 2015. The World Bank highlights the fact that, whilst absolute poverty in
Mauritius is negligible by international standards, income inequality and relative poverty have been on the rise, especially amongst
the youth and women. These could have important implications for inclusion and inter-generational transmission of poverty.
Relative poverty has increased from 8.5% in 2007 to 9.8% in 2012. At the same time, income growth of the bottom 40% of the
population has been limited and constrained at an annual rate of increase of 1.8% compared to 3.1% for the population at large.
Consequently, the middle class has shrunk during the last five years and is becoming increasingly vulnerable to falling back into
poverty, thus putting growing pressure on the bottom 40% of the population to achieve or retain their middle class status.
This phenomenon could seriously jeopardise the country’s ambition to reach high-income status within the next 5-6 years and would
require urgent attention of the decision-makers.
GROWTH CONTRIBUTION IN PER CAPITA TERMS