


 94 / 316

AfrAsia Bank Limited and its Group Entities
Annual Report 2015
page 92
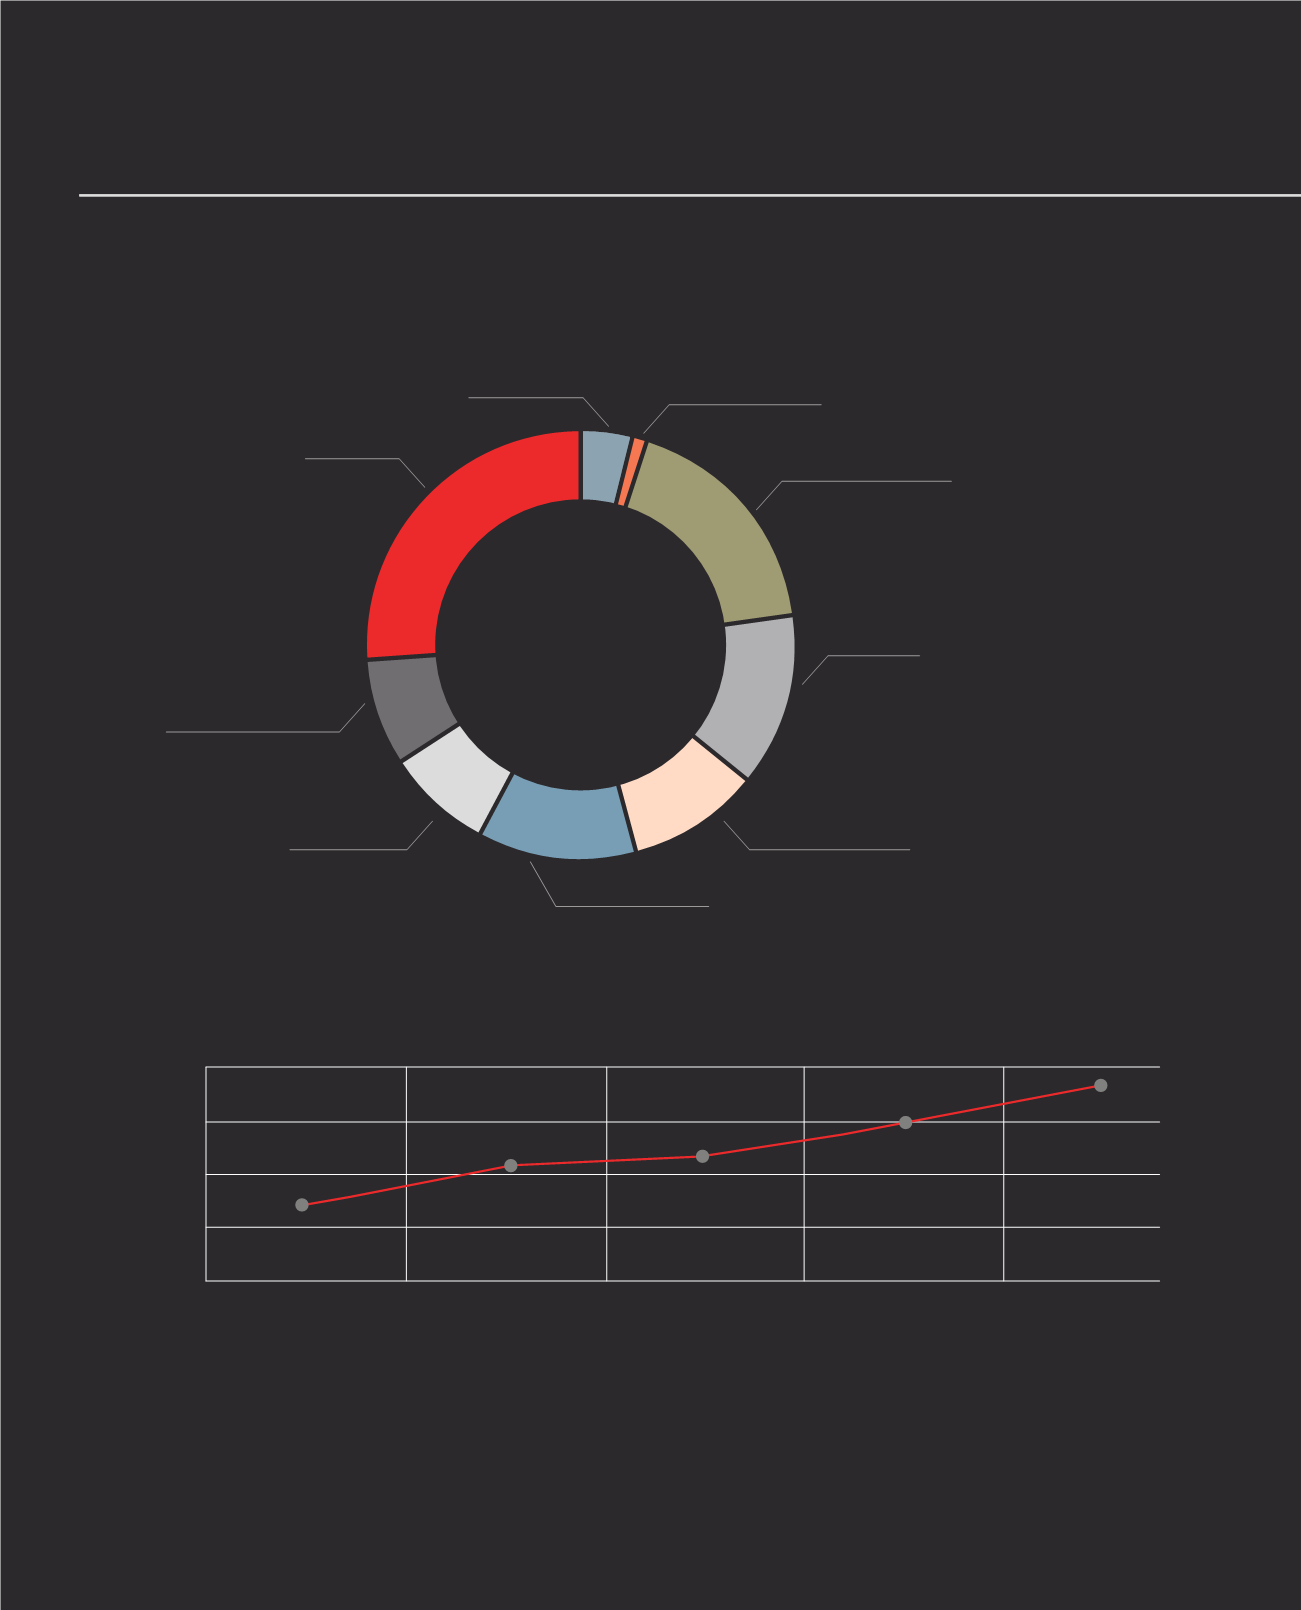
Others
26%
Agriculture and
Fishing
4%
Information,
Communication
and Technology
1%
Financial and
Business Services
18%
Construction,
Infrastructure
and Real State
10%
Manufacturing
12%
Commerce
8%
Tourism
13%
Individuals
(Incl. Credit Cards)
8%
UTILISATION LEVEL
OUTSTANDING BALANCE - PAST 5 YEARS
During the Financial Year 2014/15, AfrAsia Bank Limited has taken active steps in prudently managing its exposures and ensuring that its
loan book is judiciously diversified, while periodically conducting stress tests to assess the resilience of its portfolio in case of unfavourable
events. Over the years, the Bank has been keeping close attention to its credit concentration to ensure it meets regulatory requirements.
24,000,000
18,000,000
12,000,000
6,000,000
June 2011
June 2012
June 2013
June 2014
June 2015
0
8,610,253
12,870,185
14,090,031
17,654,400
22,093,857
RISK MANAGEMENT REPORT (CONTINUED)