


 136 / 316

AfrAsia Bank Limited and its Group Entities
Annual Report 2015
page 134
Private flows are expected to play a non-negligible role in financing the post-2015 Development Agenda.
The economic and finance landscape on mainland Africa has been transformed during the past decade into one that attracts more and
more private flows such as FDI, portfolio investments and remittances, and less official development assistance.
In 2014, total external flows to Africa were estimated at USD 181bn, 6% lower in nominal terms than in 2013. One explanation for this
decrease was the sharp drop in portfolio flows and the slight decline in FDI flows, reflecting subdued global demand and weaker commodity
prices, especially for metals. This decline offset the slight increase in remittances (+2.1%) and official development assistance (+1.1%).
All in all, estimates for total external flows averaged 7.3% of GDP in 2014, compared to 8.2% in 2013.
FINANCIAL FLOWS AND TAX REVENUES TO AFRICA (CURRENT USD, BILLION), 2005-2015
2005 2006 2007 2008 2009 2010 2011 2012 2013 2014 (e) 2015 (p)
Foreign
Private
Public
Inward Foreign Direct
investments
33.8 35.4 52.8 66.4 55.1 46.0 49.8 49.7 54.2 49.4 55.2
Portfolio Investments
6.3 22.5 14.4 -24.6 -0.3 21.5 6.8 25.7 21.5 13.5 18.4
Remittances
33.3 37.3 44.0 48/0 45.2 51.9 55.7 61.2 60.6 61.8 64.6
Official development
assistance (net total, all
donors)
35.8 44.6 39.5 45.2 47.9 48.0 51.8 51.3 55.8 56.3 54.9
Total Foreign Flows
109.2 139.7 150.6 135.0 147.9 167.3 164.0 187.9 192.0 181.1 193.0
Domestic
Tax Revenues
258.1 305.9 343.4 442.4 330.6 408.3 462.9 515.1 507.4
Total Foreign
Flows
Low-Income Countries
21.8 22.8 29.5 36.5 36.9 39.5 47.5 47.9 49.7 52.3 54.2
Low-Middle-Income
Countries
61.7 78.4 84.1 81.8 69.4 94.7 84.9 109.1 111.9 96.3 105.2
Upper-Middle-Income
Countries
23.2 35.6 33.2 11.9 35.9 28.1 26.5 25.6 26.0 26.9 26.6
Financial flows and tax revenues to Africa (current USD, bn), 2005-2015
Source: Africa Economic Outlook 2015
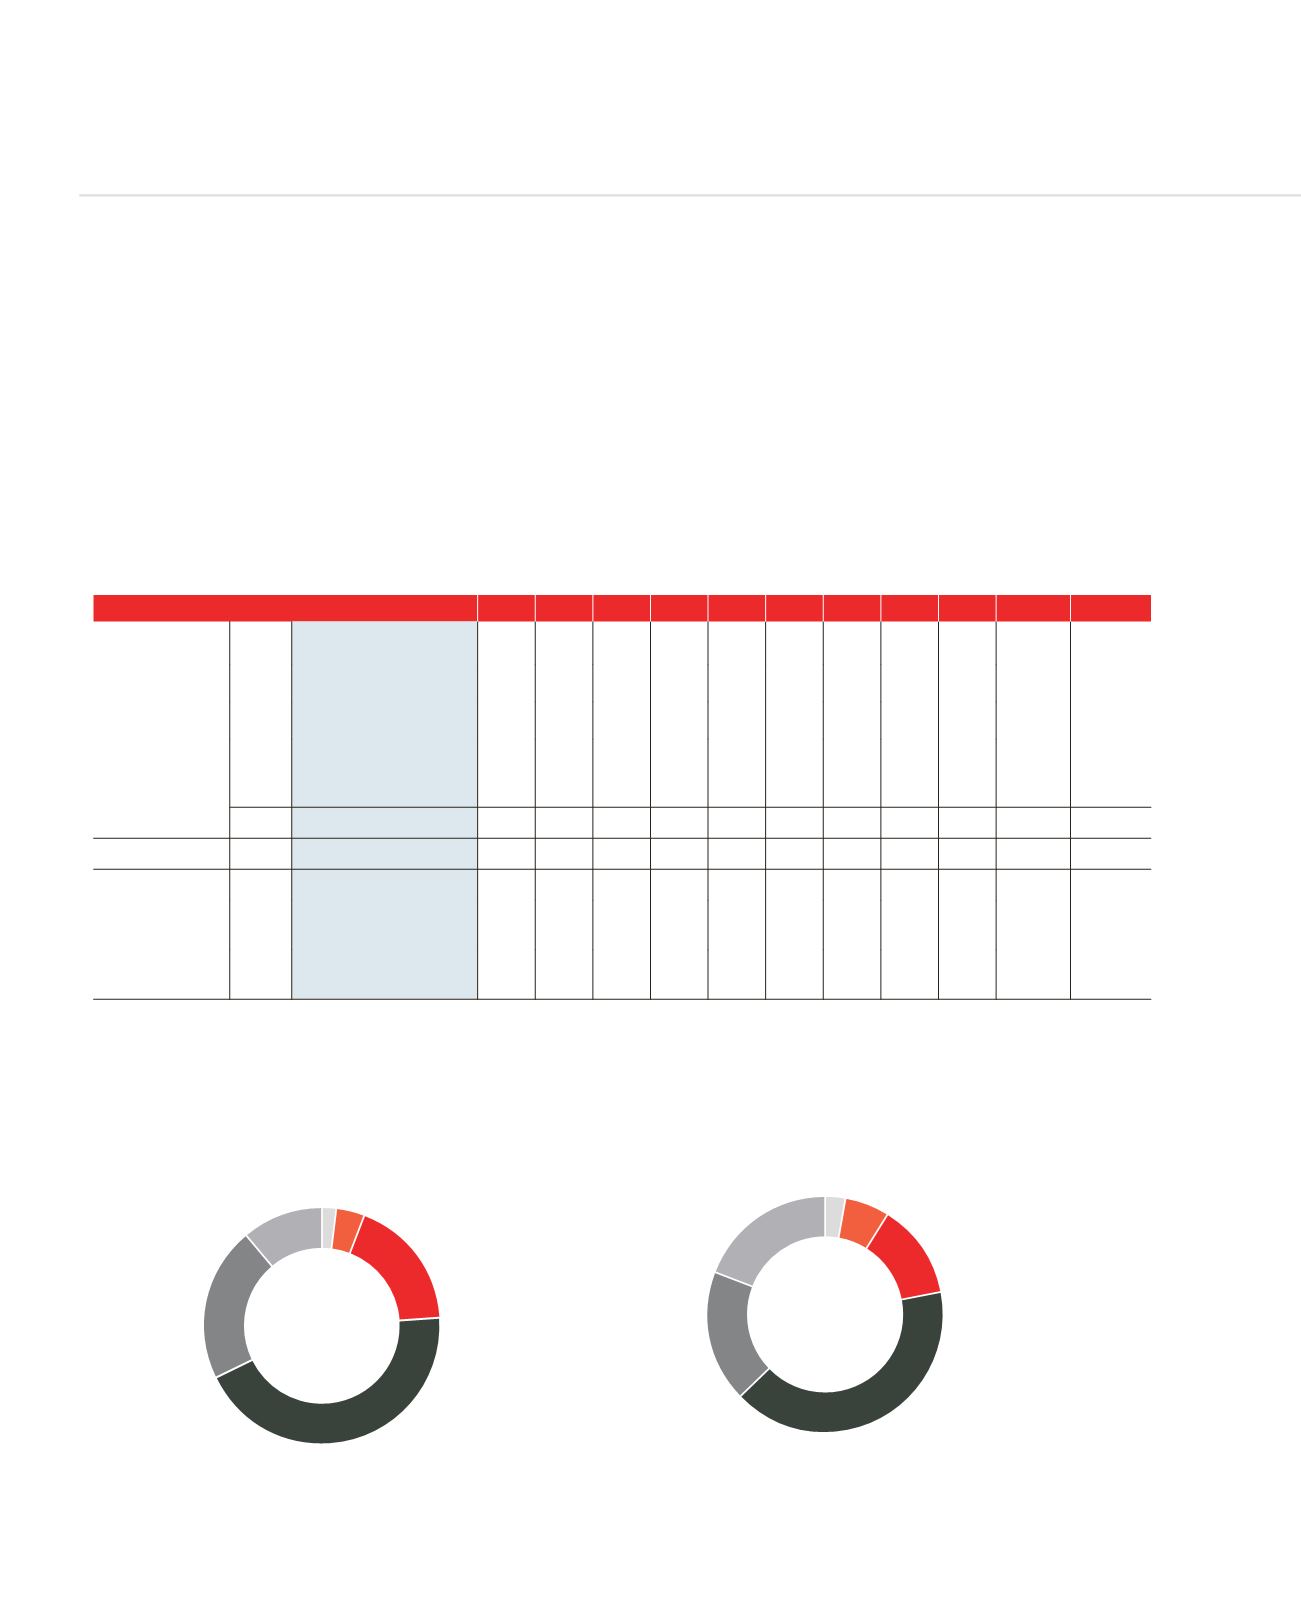
Sources of greenfield investment in Africa (by number of projects), 2003-2008 and 2009-2014
Source: Africa Economic Outlook 2015
SOURCES OF GREENFIELD INVESTMENT IN AFRICA (BY NUMBER OF PROJECTS), 2003-2008 AND 2009-2014
A. 2003-2008
B. 2009-2014
China
3%
India
6%
North
America
13%
Europe
41%
Africa
19%
Rest of
the world
18%
Europe
44%
China
2%
India
4%
North
America
18%
Rest of
the world
21%
Africa
11%
MANAGEMENT DISCUSSION AND ANALYSIS (CONTINUED)