


 109 / 316

AfrAsia Bank Limited and its Group Entities
Annual Report 2015
page 107
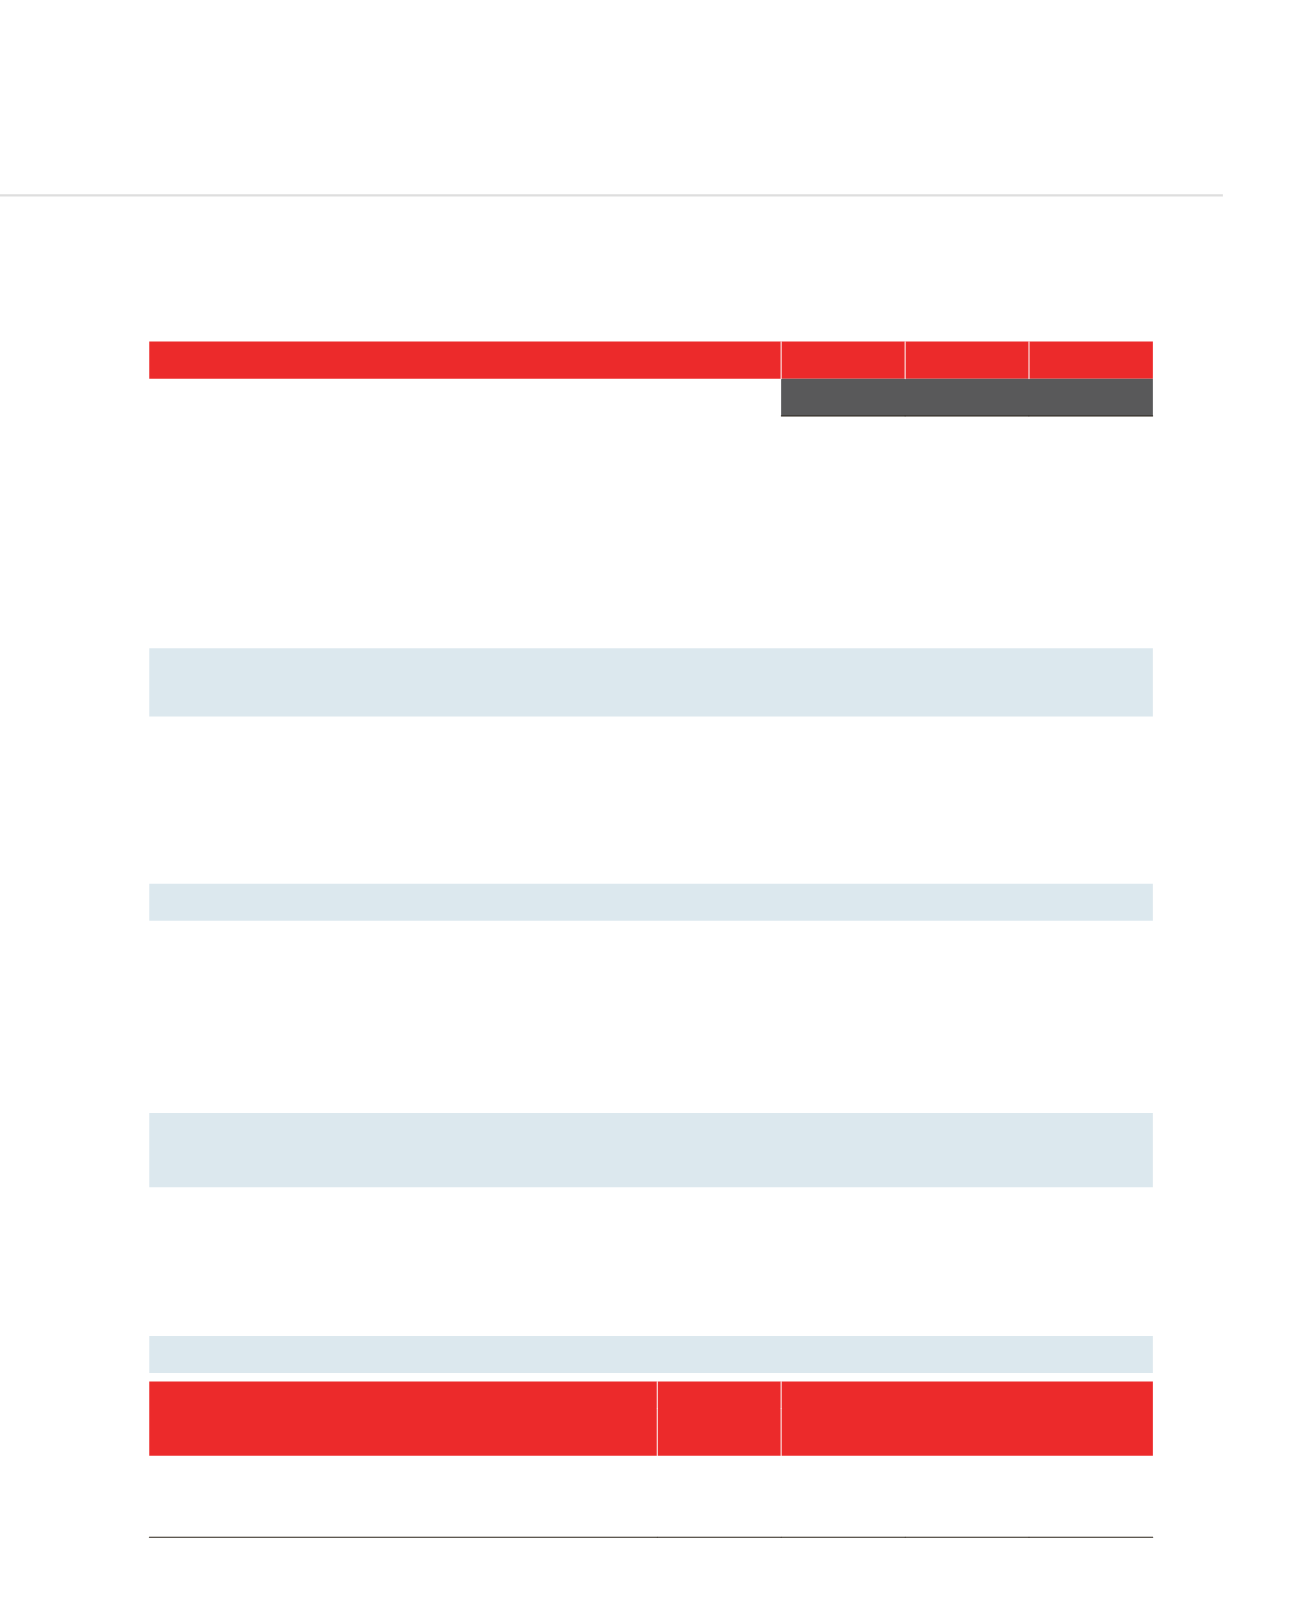
AFRASIA BANK LIMITED BASEL
BASEL III
BASEL II
BASEL II
2015
2014
2013
MUR’000
MUR’000 MUR’000
Additional Tier 1 capital: instruments
Instruments issued by the Bank that meet the criteria for inclusion in Additional
Tier 1 capital (not included in CET1)
1,319,420
-
-
Additional Tier 1 capital before regulatory adjustments
1,319,420
-
-
Additional Tier 1 capital: regulatory adjustments
Total regulatory adjustments to Additional Tier 1 capital
-
-
-
Additional Tier 1 capital (AT1)
1,319,420
-
-
Tier 1 capital (T1 = CET1 + AT1)
4,016,507 2,797,818
1,892,472
Tier 2 capital: instruments and provisions
Instruments issued by the Bank that meet the criteria for inclusion in Tier 2 capital
(and are not included in Tier 1 capital)
684,463
836,345
841,301
Provisions or loan-loss reserves (subject to a maximum of 1.25 percentage points
of credit risk-weighted risk assets calculated under the standardised approach)
307,117
219,363
155,479
Tier 2 capital before regulatory adjustments
991,580 1,055,708
996,780
Tier 2 capital: regulatory adjustments
Significant investments in the capital of banking, financial and insurance entities
that are outside the scope of regulatory consolidation (net of eligible short
positions)
(94,781)
(356,045)
(191,557)
Other Adjustments to Tier 2 capital
-
-
-
Total regulatory adjustments to Tier 2 capital
(94,781)
(356,045)
(191,557)
Tier 2 capital (T2)
896,799
699,663
805,223
Total Capital (capital base) (TC = T1 + T2)
4,913,306 3,497,481 2,697,695
Risk weighted assets
Credit Risk
33,646,596 25,170,144 20,215,748
Market Risk
491,320
418,328
681,890
Operational Risk
1,743,573 1,168,809
765,474
Total risk weighted assets
35,881,489 26,757,280 21,663,112
Capital ratios (as a percentage of risk weighted assets)
Regulatory
Limits Under
Basel III
CET1 capital ratio
6.0%
7.5%
N/A
N/A
Tier 1 capital ratio
7.5%
11.2%
N/A
N/A
Total capital ratio
10.0%
13.7%
13.1%
12.5%
CAPITAL STRUCTURE AND ADEQUACY (CONTINUED)