


 118 / 316

AfrAsia Bank Limited and its Group Entities
Annual Report 2015
page 116
MANAGEMENT DISCUSSION AND ANALYSIS (CONTINUED)
High expectations for a new growth model
In its 2015-2019 programme, the Government declared its objective to “transform Mauritius into a truly forward looking, environmentally
sustainable, economically vibrant and innovative country with modern infrastructure, global connectivity, high skills and technology.” Heavy
emphasis is laid on high-quality infrastructure to boost Mauritius’ productivity and competitiveness indicators. The infrastructure vision,
as elaborated in the Public Sector Investment Programme January 2015 - June 2019, is expected to cost some USD 4bn.
The policy agenda promising a ‘second economic miracle’ is expected to be largely based on social cohesion and inclusive growth.
Incidentally, the new government comprises the same Prime Minister and the same Finance Minister as during the ‘first economic miracle’.
The latter is often referred to in Mauritius as the period beginning in the mid-1980s and extending to the late 1990s. Between 1973 and
1999, despite low initial conditions, real GDP growth in Mauritius averaged 5.9% per year as compared with 2.4% in Africa. In terms of per
capita income, the achievements were 3.25% and about 0.7% respectively. As reported by Subramaniam and Roy, the income of the average
Mauritian has increased three and a half times over a forty-year period, while that of the average African has increased by 32%.
Renewed emphasis on governance
The authorities have vowed to lay heavy emphasis on governance and transparency in all their dealings. A new Ministry of Financial
Services, Good Governance and Institutional Reforms has been set up, which is proposing to enact several new legislations in 2015 and
2016 to strengthen governance, ethics and enhanced financial reporting in Mauritius and, above all, improve Mauritius’ rankings in the
World Governance Indicators as well as control of corruption.
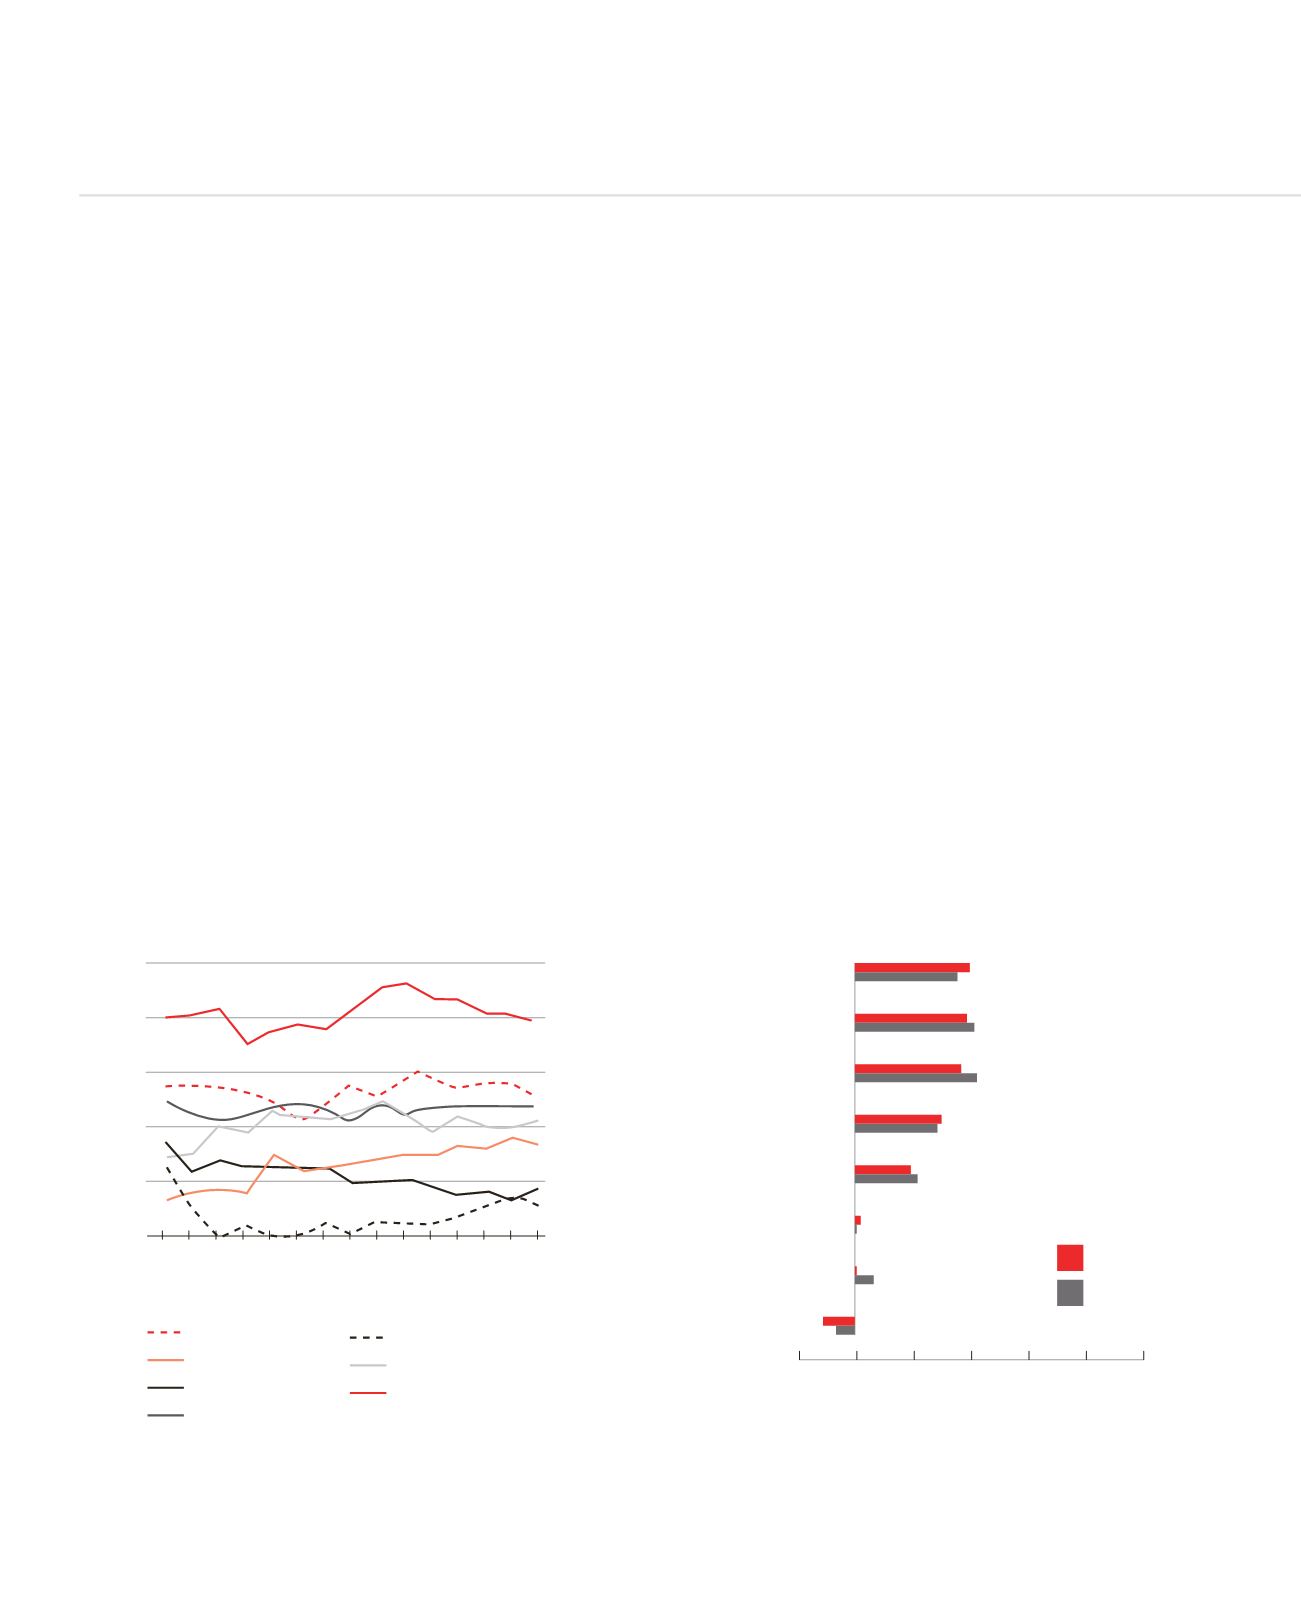
GOVERNANCE EFFECTIVENESS, 1996-2013
VOICE AND ACCOUNTABILITY, 2005-2013
1996
1998
2000
2002
2003
2004
2005
2006
2007
2008
2009
2010
2011
2012
2013
0.0
0.5
-0.5
1.0
1.5
2.0
2.5
Barbados
Mauritius
South Africa
Chile
Seychelles
Malaysia
Singapore
Barbados
OECD
Chile
Mauritius
South Africa
Singapore
Seychelles
Malaysia
-0.5
0.5 1.0 1.5 2.0 2.5
0
Score (-2.5 to 2.5)
2013
2005
Governance effectiveness, 1996-2013
Source: Worldwide Governance Indicators
Voice and accountability 2005-2015
Source: Worldwide Governance Indicators