


 295 / 316

AfrAsia Bank Limited and its Group Entities
Annual Report 2015
page 292
noteS to the finanCial StatementS
for the year ended 30 June 2015
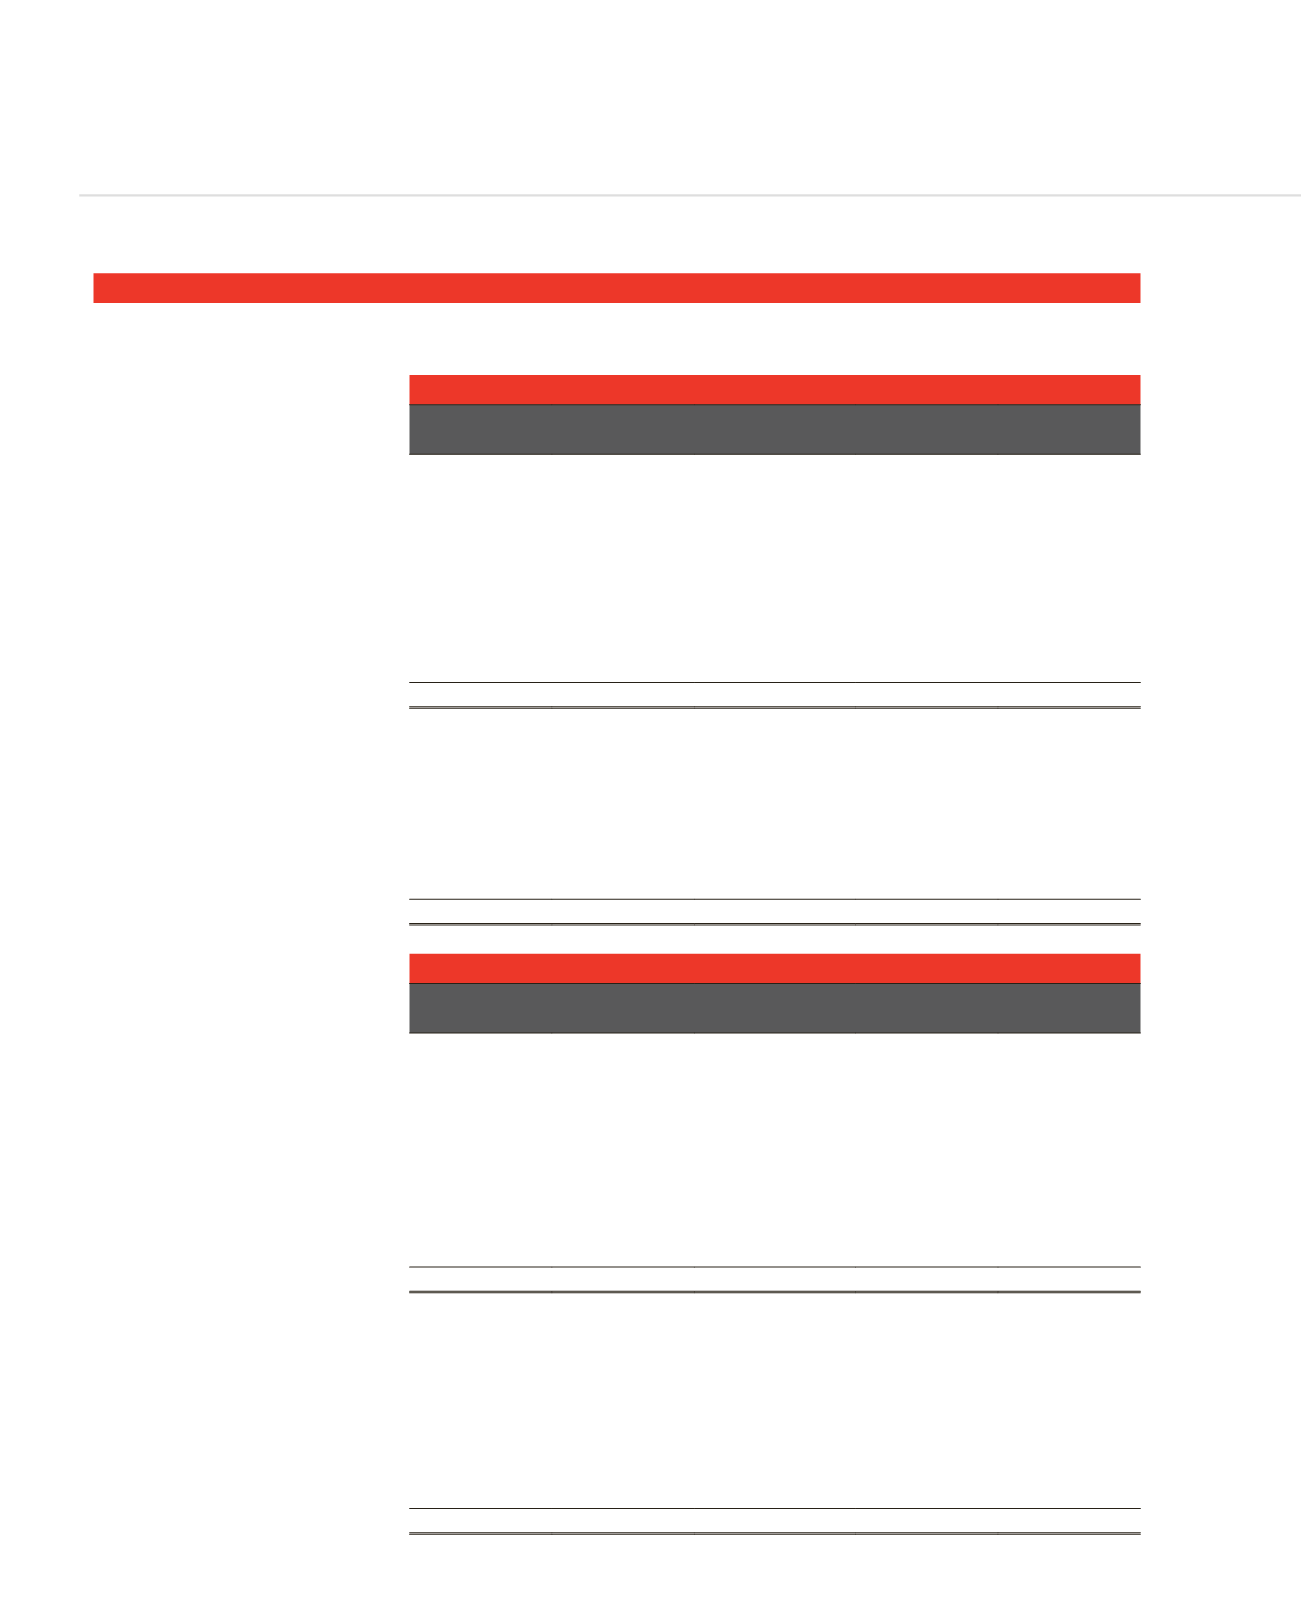
42. OFFSETTING FINANCIAL INSTRUMENTS (CONTINUED)
THE BANK (CONTINUED)
2014
Effect of offsetting on statement of financial position
Related amounts not offset
Gross amounts
Amount offset
Net amount reported
on balance sheet
Cash collateral
Net amount
MUR
MUR
MUR
MUR
MUR
ASSETS
Cash and balances with the Central Bank 2,019,624,517
-
2,019,624,517
-
2,019,624,517
Due from banks
18,251,137,955
-
18,251,137,955
-
18,251,137,955
Derivative financial instruments
110,195,681
(34,107,407)
76,088,274
-
76,088,274
Financial investments - held-for-trading
1,911,412,121
-
1,911,412,121
-
1,911,412,121
Loans and advances to customers
17,397,054,742
-
17,397,054,742
(359,380,491)
17,037,674,251
Financial investments - held-to-maturity
6,836,836,907
-
6,836,836,907
-
6,836,836,907
Other assets
174,217,269
-
174,217,269
-
174,217,269
46,700,479,191
(34,107,407)
46,666,371,784
(359,380,491)
46,306,991,293
LIABILITIES
Due to banks
1,015,349,802
-
1,015,349,802
-
1,015,349,802
Derivative financial instruments
106,792,317
(34,107,407)
72,684,910
-
72,684,910
Deposits from customers
41,089,954,783
-
41,089,954,783
(359,380,491)
40,730,574,292
Debts issued
1,033,574,296
-
1,033,574,296
-
1,033,574,296
Current tax liabilities
44,739,421
-
44,739,421
-
44,739,421
Other liabilities
599,508,601
-
599,508,601
-
599,508,601
43,889,919,220
(34,107,407)
43,855,811,813
(359,380,491)
43,496,431,322
2013
Effect of offsetting on statement of financial position
Related amounts not offset
Gross amounts
Amount offset
Net amount reported
on balance sheet
Cash collateral
Net amount
MUR
MUR
MUR
MUR
MUR
ASSETS
Cash and balances with the Central Bank
1,598,715,632
-
1,598,715,632
-
1,598,715,632
Due from banks
9,009,807,334
-
9,009,807,334
-
9,009,807,334
Derivative financial instruments
62,723,496
(37,086,335)
25,637,161
-
25,637,161
Financial investments - held-for-trading
532,685,518
-
532,685,518
-
532,685,518
Loans and advances to customers
14,007,752,016
-
14,007,752,016
(397,680,370)
13,610,071,646
Financial investments - held-to-maturity
5,807,802,824
-
5,807,802,824
-
5,807,802,824
Other assets
41,951,992
-
41,951,992
-
41,951,992
31,061,438,812
(37,086,335)
31,024,352,477
(397,680,370)
30,626,672,107
LIABILITIES
Due to banks
881,908,278
-
881,908,278
-
881,908,278
Derivative financial instruments
86,784,019
(37,086,335)
49,697,684
-
49,697,684
Deposits from customers
27,232,616,080
-
27,232,616,080
(397,680,370)
26,834,935,710
Debts issued
883,069,803
-
883,069,803
-
883,069,803
Amount due to subsidiary
57,253,644
-
57,253,644
-
57,253,644
Current tax liabilities
22,175,979
-
22,175,979
-
22,175,979
Other liabilities
138,309,815
-
138,309,815
-
138,309,815
29,302,117,618
(37,086,335)
29,265,031,283
(397,680,370)
28,867,350,913