


 190 / 316

AfrAsia Bank Limited and its Group Entities
Annual Report 2015
page 187
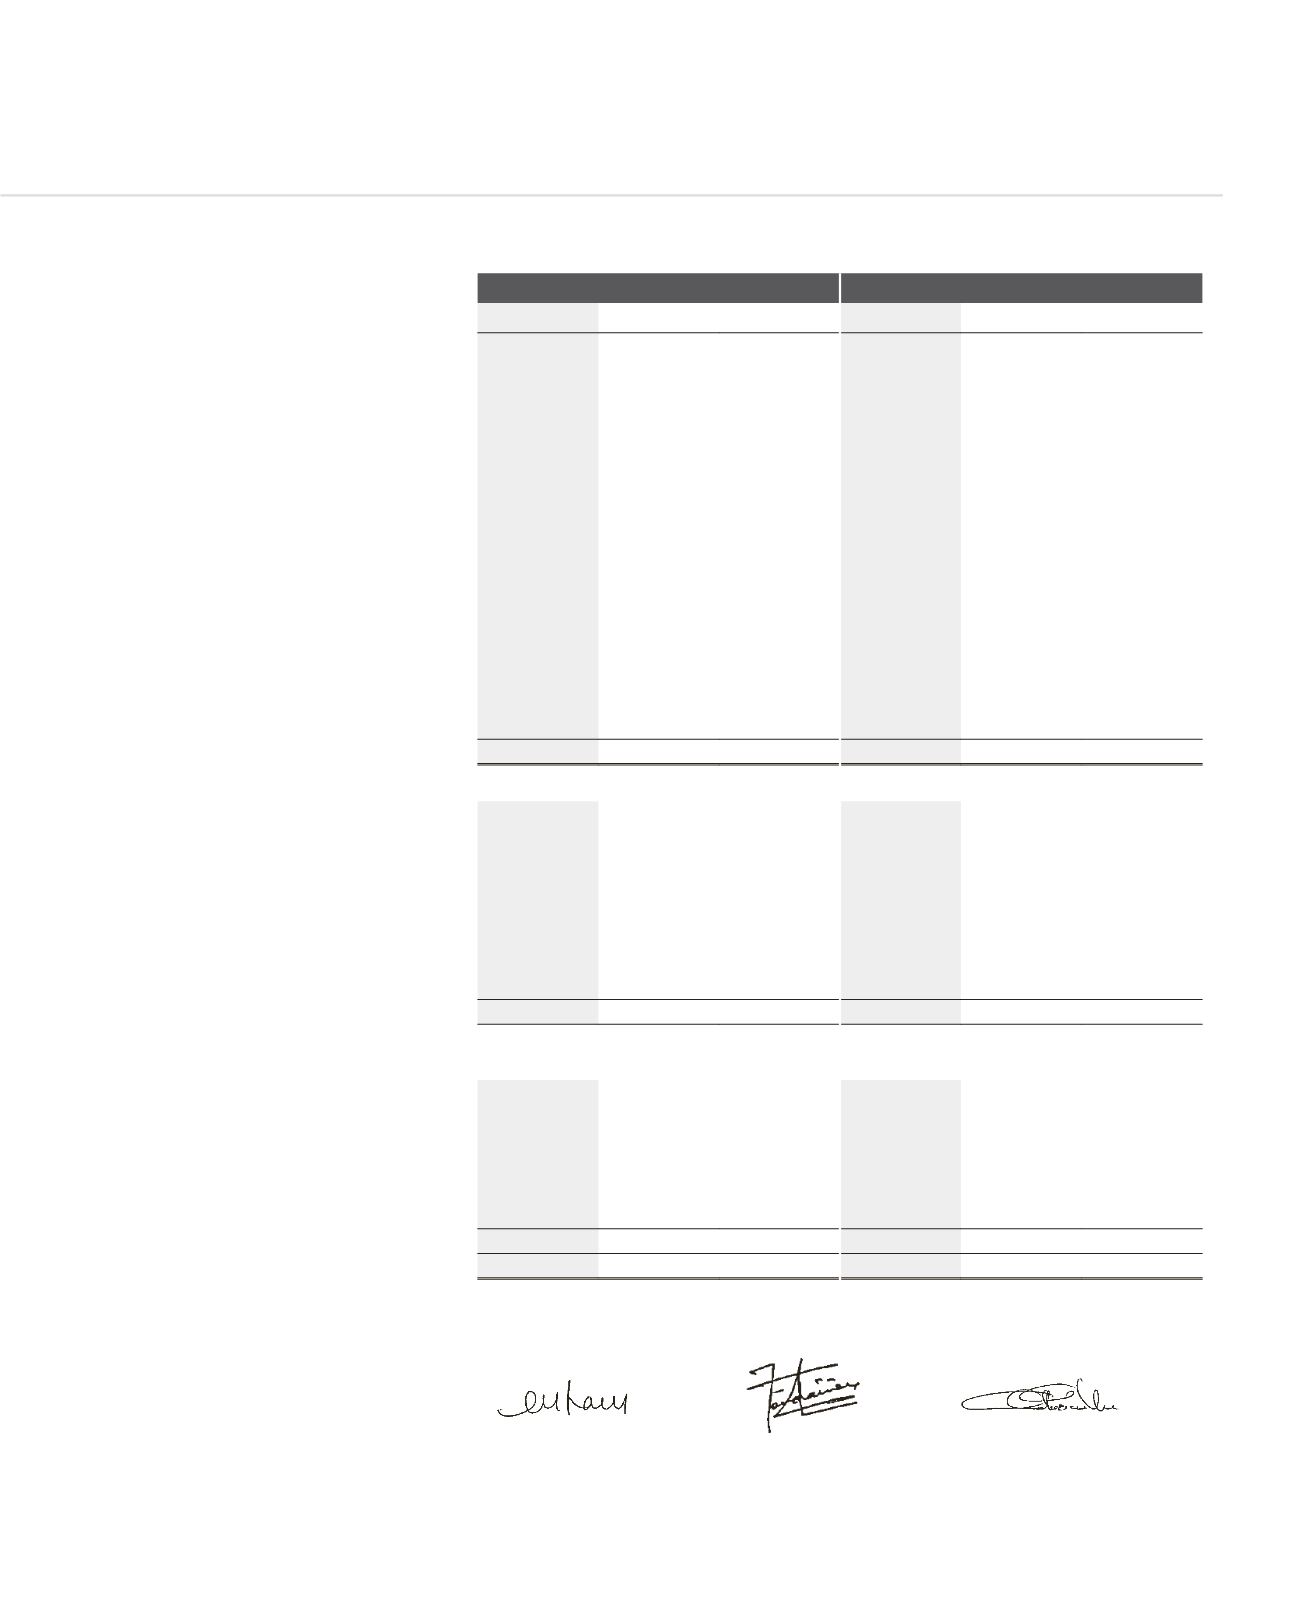
THE GROUP
THE BANK
2015
2014
2013
2015
2014
2013
Notes
MUR
MUR
MUR
MUR
MUR
MUR
ASSETS
Cash and balances with the Central Bank 12
2,514,212,771
2,021,271,956 1,598,715,632
2,512,469,499
2,019,624,517 1,598,715,632
Due from banks
13
41,447,016,418
18,265,309,349 9,009,843,939
41,434,529,360
18,251,137,955 9,009,807,334
Derivative financial instruments
14
217,383,148
860,845,449
68,581,360
68,527,133
76,088,274
25,637,161
Financial investments - held-for-trading
15
3,045,473,857
2,636,144,938
532,685,518
1,967,124,284
1,911,412,121
532,685,518
Loans and advances to customers
16
21,772,734,670
17,227,454,645 14,007,752,016
21,707,867,640
17,397,054,742 14,007,752,016
Financial investments – available-for-sale 17
41,049,271
341,340,318
40,722,657
-
-
-
Financial investments - held-to-maturity
17
5,071,692,345
6,836,836,907 5,807,802,824
5,071,692,345
6,836,836,907 5,807,802,824
Investment in subsidiaries
18
-
-
-
189,562,500
409,800,877
383,115,237
Investment in joint venture
21
-
-
55,177,034
-
-
-
Investment in associates
22
-
118,564,966
225,313,514
-
-
-
Equipment
23
103,495,720
71,207,441
28,763,936
98,955,009
66,310,161
28,756,687
Intangible assets
24
356,071,478
401,506,929
15,420,212
48,018,166
37,666,566
15,420,212
Other assets
25
263,743,208
197,071,143
165,323,024
288,150,481
174,217,269
41,951,992
Deferred tax assets
10
24,060,186
12,644,071
8,055,035
19,607,046
8,897,222
8,055,035
TOTAL ASSETS
74,856,933,072
48,990,198,112 31,564,156,701
73,406,503,463
47,189,046,611 31,459,699,648
LIABILITIES AND EQUITY
Due to banks
26
227,418,091
1,015,349,802
881,908,278
227,411,484
1,015,349,802
881,908,278
Derivative financial instruments
14
555,094,453
857,442,085
66,241,883
54,775,438
72,684,910
49,697,684
Deposits from customers
27
66,437,715,715
40,413,543,682 27,224,339,709
66,928,650,521
41,089,954,783 27,232,616,080
Debts issued
28
2,691,570,175
2,433,941,196
940,323,447
1,094,274,560
1,033,574,296
883,069,803
Amount due to subsidiary
29
-
-
-
-
-
57,253,644
Other liabilities
30
591,539,131
766,500,126
231,773,086
531,786,209
599,508,601
138,309,815
Current tax liabilities
10
67,835,800
53,040,200
22,175,979
51,327,383
44,739,421
22,175,979
Deferred tax liabilities
10
114,281
-
-
-
-
-
TOTAL LIABILITIES
70,571,287,646
45,539,817,091 29,366,762,382
68,888,225,595
43,855,811,813 29,265,031,283
EQUITY ATTRIBUTABLE TO EQUITY
HOLDERS OF THE PARENT
Ordinary shares
31
2,590,959,243
1,747,639,471 1,694,593,418
2,590,959,243
1,747,639,471 1,694,593,418
Class A shares
31
1,399,768,119
1,400,244,201
-
1,385,768,119
1,386,244,201
-
Treasury shares
31
-
(405,776,236)
-
-
(405,776,236)
-
Share application monies
31
17,261,328
-
-
17,261,328
-
-
(Accumulated losses)/Retained earnings
(142,091,309)
434,095,763
290,049,913
107,087,117
332,174,586
290,007,317
Other reserves
32
419,748,045
274,177,822
212,750,988
417,202,061
272,952,776
210,067,630
TOTAL EQUITY
4,285,645,426
3,450,381,021
2,197,394,319
4,518,277,868
3,333,234,798 2,194,668,365
TOTAL LIABILITIES AND EQUITY
74,856,933,072
48,990,198,112 31,564,156,701
73,406,503,463
47,189,046,611 31,459,699,648
The financial statements have been approved for issue by the Board of Directors on 24 September 2015.
LIM SIT CHEN LAM PAK NG
JEAN DE FONDAUMIÈRE
CATHERINE MCILRAITH
Chairman
Director
Director
The notes on pages 191 to 307 form an integral part of these financial statements.
Auditors’ report on page 185.
StatementS of finanCial poSition
aS at 30 June 2015